

The peak of hurricane season, with all of its uncertainties for North Carolina, is upon us. Local, state, and federal governments are paying close attention to the turbulent winds spawning off the east coast of Africa. Those winds grow to tropical depressions, and then, fed by the heat in the warm Atlantic waters, turn into full-blown hurricanes.
This process has been observed for centuries, and today scientists, economists and homeowners are able to meticulously track these gargantuan storms. Knowing what tools are available, and how to interpret forecasting data, can help NC home and business owners be better prepared.
Federal tracking
The national government has stepped up efforts to better inform individuals to both prepare for future damage and to survive the extreme weather and flooding crisis. Technology has been enhanced and models improved so that everyone can access the most cutting-edge data available.
Hurricane Florence resulted in 53 deaths and up to $24 billion in damages [as a Category 1 storm at landfall].
The National Weather Service, part of the National Oceanic and Atmospheric Administration (NOAA), has a division focused exclusively on hurricanes. This division, the National Hurricane Center (NHC), provides up-to-the-minute updates on its website as well as through a powerful smartphone app (“NHC Data,” available from Apple and Google Play app stores). The app gives radar and satellite images, forecasts and hurricane cones and advisories with maps of potential flooding from storm surge.
Dr. Mike Brennan, the NHC Branch Chief of the Hurricane Specialist Unit, explains that hurricane tracking is much more than estimating the Saffir–Simpson hurricane wind scale, or category. In fact, the category of a hurricane can be deceptive.
“People might think that since a hurricane is downgraded from a Category Four to a Category One that it will not be as destructive,” Dr. Brennan says. “But Hurricane Florence resulted in 53 deaths and up to $24 billion in damages [as a Category 1 storm at landfall].”
Reading the data
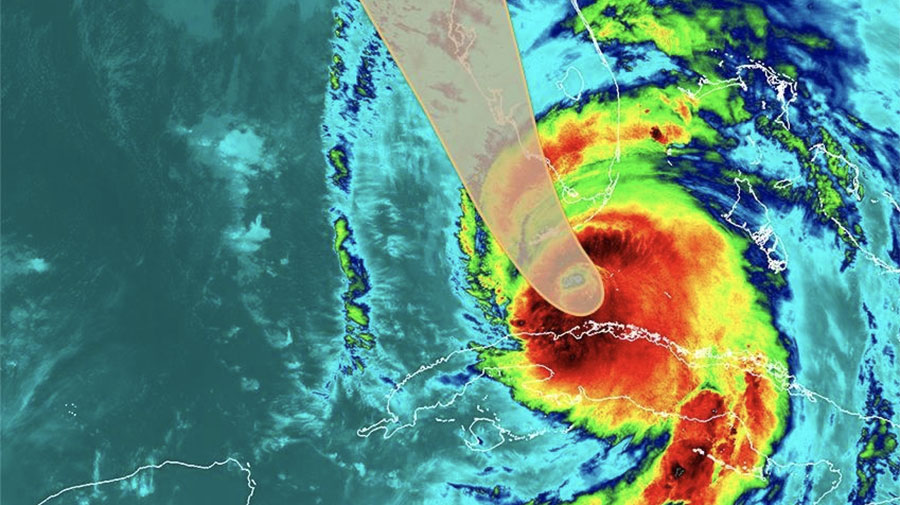
A better way of thinking about hurricanes’ destructive power is to consider the various hazards that a hurricane can potentially cause. Knowing what storm tracking resources can and cannot tell you makes a big difference in planning ahead of a storm. For example, those cone graphics, predicting where a hurricane may travel within a range of possible directions, can be deceiving.
“The cone graphics show where the eye of the storm is,” explains Steve Pfaff, Warning Coordination Meteorologist for the National Weather Service in Wilmington. “The hurricane itself is over 600 miles wider than the cone.” Even though the cone may not include your part of the map, the storm outside of the cone can still be dangerous.
Preparing for flooding
The art of predicting water levels from rainfall accumulation can be challenging.
“Much is evolving in our understanding, but there is still an unknown,” explains NOAA Senior Service Hydrologist Rick Neuherz.
That said, a new tool is being tested that forecasts rainfall accumulations more accurately. Instead of using predictive models, scientists have developed a probabilistic model, which gives a range of possibilities and their impacts instead of focusing on one possible outcome, even if it is the most likely.
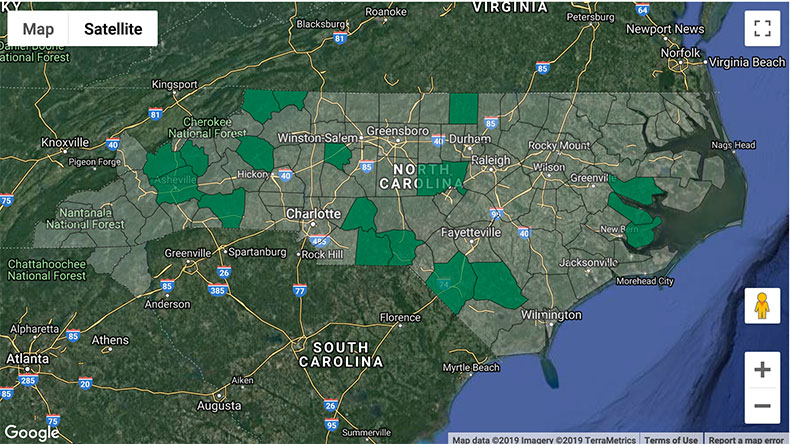
Also, the Office of Water Prediction offers an intuitive and interactive map that gives users a sense of the current and predicted river levels based on various models and factors, including rainfall, downstream flows, ground conditions, and more. North Carolina’s Flood Inundation Mapping and Alert Network provides real-time data on stream elevation, rainfall and weather parameters from more than 550 spots across the state.
There is still much to learn about hurricanes, tropical storms, catastrophic rainfall events, flooding patterns and emergency management operations. Thankfully, a range of weather specialists and professionals have created resources to assist the public’s decision-making process. Use them, study them, and make good choices when faced with future weather events.
Storm Data Rules of Thumb
1 Know your sources.
Credibility of sources is critical. Make sure you know where your sources are getting their information and check it.
2 Use a range of good sources.
Knowing a good source is good, knowing several is best. You need to ensure that your sources agree and be critical about discrepancies
3 Don’t share what you don’t know.
Sending warnings of life-threatening hazards is good, but make sure you can verify that information before you send it along.
4 Avoid anchoring on the first bit of information.
The first look at a storm is never as good as the 10th and 20th. As new information comes in, it should help you determine new plans
5 Past experiences lie.
We can become prisoners of experience, and often things are not remembered perfectly. Don’t let your experience from past hurricanes influence your actions in a new one.
6 Every storm is different.
“If you beat it once, you’re going to have the mindset that you can beat it again, and that’s not always going to be the case,” says Meteorologist Vernon Turner (see “Storm Tips from the Experts.”)
7 Heed the warnings.
The professionals in the emergency management fields know that an evacuation is terribly inconvenient, because they evacuate with you. They give the warnings because they know it is the best thing to do to keep you safe.
8 Be in the loop.
Find your local emergency management’s Facebook page, the NHC twitter account, even the short-wave radio frequency. Follow your local electric cooperative on social media, and know how to report a power outage. It pays to prepare and be aware. ReadyNC.org has great emergency preparedness resources.
If the power goes out
During severe weather, stay on top of outage information with a real-time, statewide outage map from North Carolina’s electric cooperatives.